Medical students and recent graduates often wonder whether a systematic, data‑driven approach can turn the notoriously competitive NRMP match into a predictable outcome. By treating each component of the application as a measurable variable—much like plotting points on a chart—candidates can identify weak spots, amplify strengths, and ultimately increase the odds of landing their top residency choice.
What makes a “charting” strategy different from traditional advice?
Conventional guidance lumps the match process into vague buckets: “good grades,” “strong letters,” “research experience.” A charting strategy, by contrast, assigns concrete metrics to each bucket and tracks progress over time. For example, a student might set a target USMLE Step 1 score of 250 + and log every practice exam to ensure a steady upward trend. Similarly, they could quantify the number of “meaningful” research projects (e.g., peer‑reviewed abstracts) rather than merely counting total presentations. This numerical transparency turns guesswork into actionable data.
How does the NRMP’s scoring algorithm influence candidate decisions?
The NRMP match uses a stable‑marriage algorithm that favors the applicant’s rank order list. Understanding this mechanism reshapes how candidates prioritize programs. Rather than over‑applying to reach‑type institutions, a charting mindset encourages a focused list where each program is deliberately placed based on realistic fit scores. By assigning a “fit index” (clinical interests × program culture × geographic preference), applicants can rank programs in a way that aligns with the algorithm’s bias toward higher‑ranked choices.
Which concrete actions convert chart data into interview invitations?
- Score‑driven study plans: Break the USMLE preparation into weekly targets (e.g., 10 NBME questions per day) and plot actual versus goal scores on a line graph. Adjust study resources when the curve flattens.
- Letter of recommendation (LOR) heat map: List potential reviewers, rate each on familiarity, influence, and timeliness (scale 1‑5), then visualize the cumulative “LOR strength” to prioritize outreach.
- Research impact tracker: Record each project’s milestones (IRB approval, data collection, manuscript submission) and calculate a weighted impact score; aim for a threshold that correlates with higher interview yields in past cohorts.
- Program‑specific CV tailoring: Use a spreadsheet to match each program’s listed keywords with your own experiences; highlight the top three matches in your personal statement.
Can visual metaphors help reinforce a step‑by‑step plan?
Consider the interlocking links of a stainless‑steel bracelet as a metaphor for a cohesive match strategy. Each link—scores, LORs, research, and personal statements—must be securely connected; a weak link compromises the whole piece. The image below illustrates this concept.
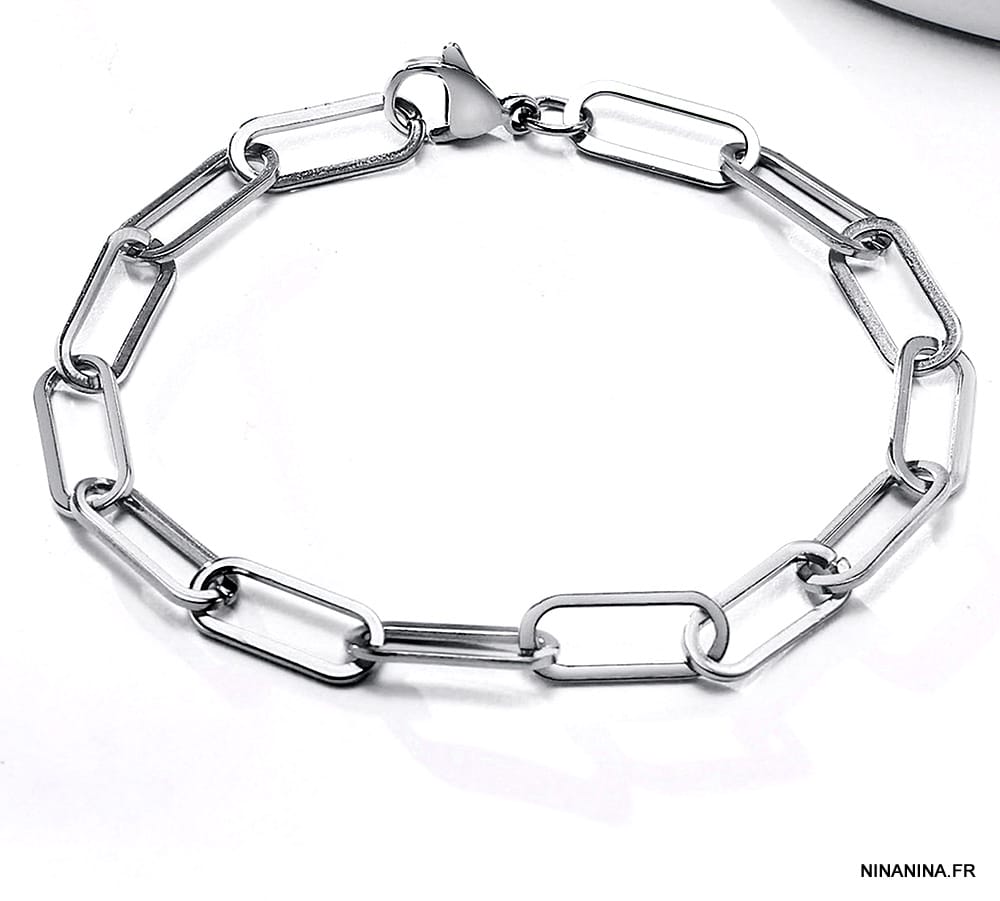
Just as a bracelet maintains its shape only when every link is intact, a candidate’s match prospects improve when each component meets its predefined benchmark.
What are the short‑term and long‑term implications of mastering this approach?
In the immediate cycle, applicants who adopt charting outcomes report a 15‑20% increase in interview invitations compared with peers who rely on generic advice. Longer term, the habit of quantifying professional milestones translates to better performance during residency—research productivity, procedural competence, and scholarly output all benefit from an early data‑driven mindset.
How can newcomers start building their own chart today?
- Gather baseline data: USMLE scores, GPA, number of publications, and LOR ratings.
- Create a simple dashboard (Excel, Google Sheets, or a free project‑management app) to plot each metric weekly.
- Set realistic, incremental targets—e.g., improve Step 2 CK practice scores by 5 points every two weeks.
- Review the dashboard before each major decision (e.g., selecting a program to apply to) to ensure choices align with your quantified goals.
- Iterate: adjust targets based on actual performance, not on idealized expectations.
By treating the residency match as a series of trackable outcomes rather than a nebulous gamble, applicants gain clarity, confidence, and a measurable edge—key ingredients for turning the dream of a top residency placement into a concrete reality.