Many elementary classrooms rely on a printed multiplication chart, yet teachers and parents often hear the same complaint: “It just isn’t helping my child learn the facts.” The problem isn’t the concept of a chart itself; it’s how the chart is designed, presented, and used. Below we break down the most common pitfalls and offer concrete fixes that turn a static sheet into a powerful learning tool.
What design flaws make a chart ineffective?

Most printed charts cram all 144 products into a single grid, using the same font size and color for every cell. This uniformity hides natural patterns—like the 5‑s and 9‑s tricks—that could cue memory. Additionally, a lack of visual hierarchy forces students to scan the entire page instead of focusing on the row or column they need.
Why do learners rely on rote memorization instead of pattern recognition?
When a chart offers no visual cues, students assume they must memorize each cell individually. The brain then treats each product as an isolated fact, increasing cognitive load and slowing retrieval. Research on spaced repetition shows that recognizing relationships (e.g., 6 × 7 equals 7 × 6) yields faster mastery than memorizing 42 as an arbitrary number.
How can you restructure the chart for clarity?
- Color‑code families. Highlight all multiples of 2, 5, and 10 in distinct shades. This instantly signals “look for the even‑number pattern” or “the zero at the end.”
- Add row‑and‑column headers. Use larger, bold fonts for the top row and left column so students can locate the multiplier and multiplicand without hunting.
- Include visual anchors. Small icons (e.g., a hand for “5” because of five fingers) reinforce the mental link between number and concept.
- Leave blank cells for practice. Replace every fifth product with an empty box and a prompt like “fill in the missing 5‑times fact.” This turns passive review into active recall.
When should you replace the chart with digital alternatives?
If a classroom already uses tablets or interactive whiteboards, a dynamic chart can adapt to each learner’s pace. Apps that scramble the order of facts, provide instant feedback, and track progress outperform static sheets in long‑term retention. However, schools with limited technology budgets can still benefit from a well‑designed printable version by following the redesign steps above.
What simple habits reinforce the chart’s usefulness?
- Daily 5‑minute drill. Use the chart as a reference, but ask the child to point to the correct row and column before saying the answer.
- Pattern‑spotting challenge. Once a week, pick a multiplier (e.g., 3) and ask the student to list all products without looking, then verify with the chart.
- Cross‑checking. Encourage the learner to verify 8 × 6 by checking 6 × 8, reinforcing commutative property.
Why does fixing the chart matter beyond math?
A clear visual aid cultivates confidence. When students see patterns, they experience “aha” moments that translate to other subjects—like recognizing prefixes in language arts or cycles in science. The same design principles—contrast, hierarchy, and interactive blanks—apply to any learning scaffold.
How to implement the fixes today

Print a blank 12 × 12 grid, then apply the color‑coding and header tweaks described. Use a basic spreadsheet program to add the visual cues, or hand‑draw them for a tactile approach. Once the revised chart is on the wall, schedule a brief orientation: walk students through the color legend, demonstrate the “fill‑in” cells, and set a weekly review routine. Within a few weeks, you’ll likely notice faster recall, fewer “I don’t know” responses, and a smoother transition to higher‑order multiplication problems.
Why And When
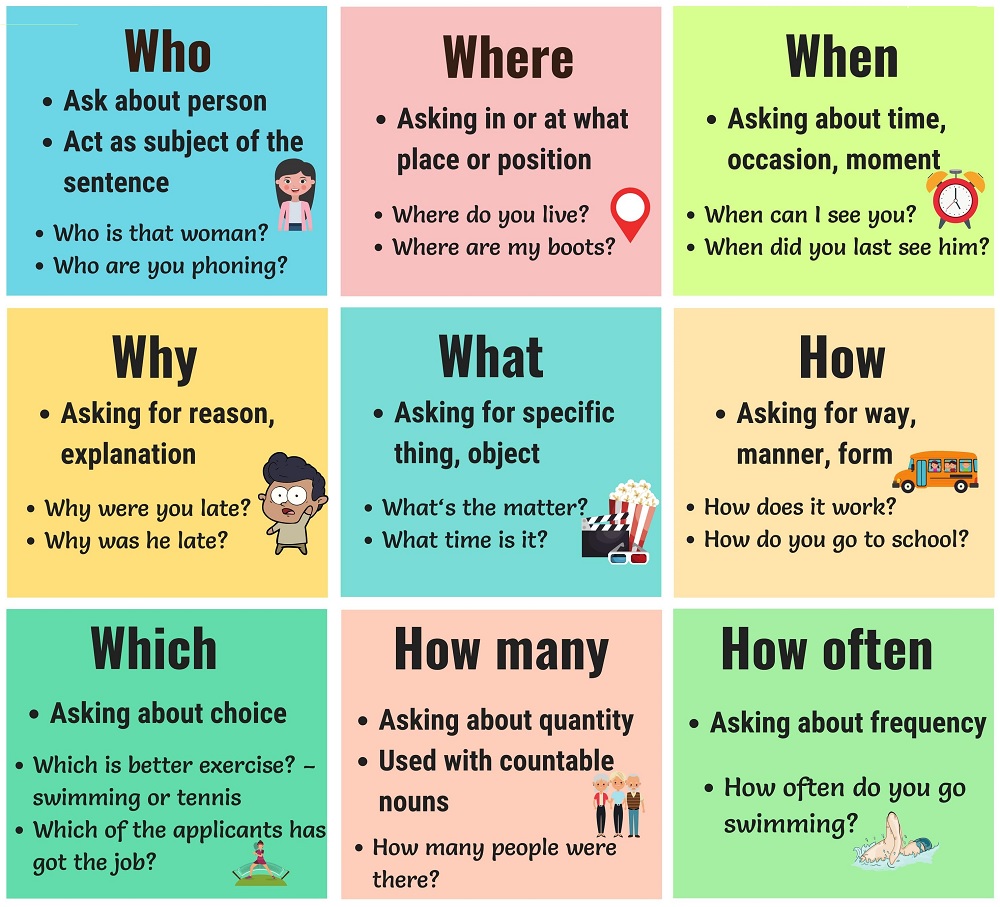
Why And When
Why How What Explained At Mark Strasser Blog

Why How What Explained at Mark Strasser blog
Why Detailed Flat Circular Flat Icon

Why Detailed Flat Circular Flat icon